Gallery

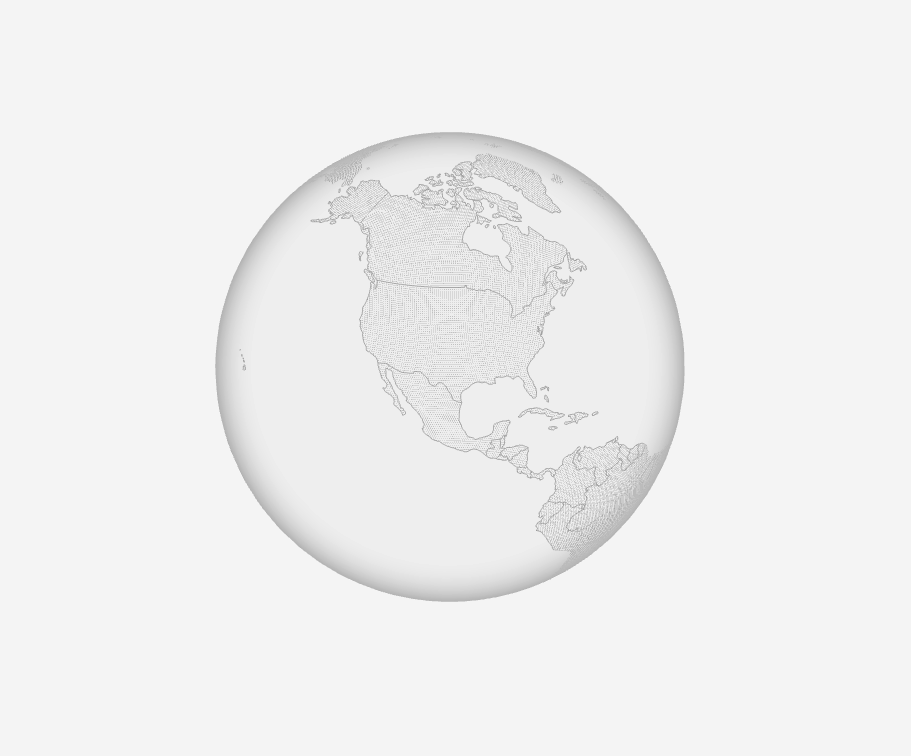
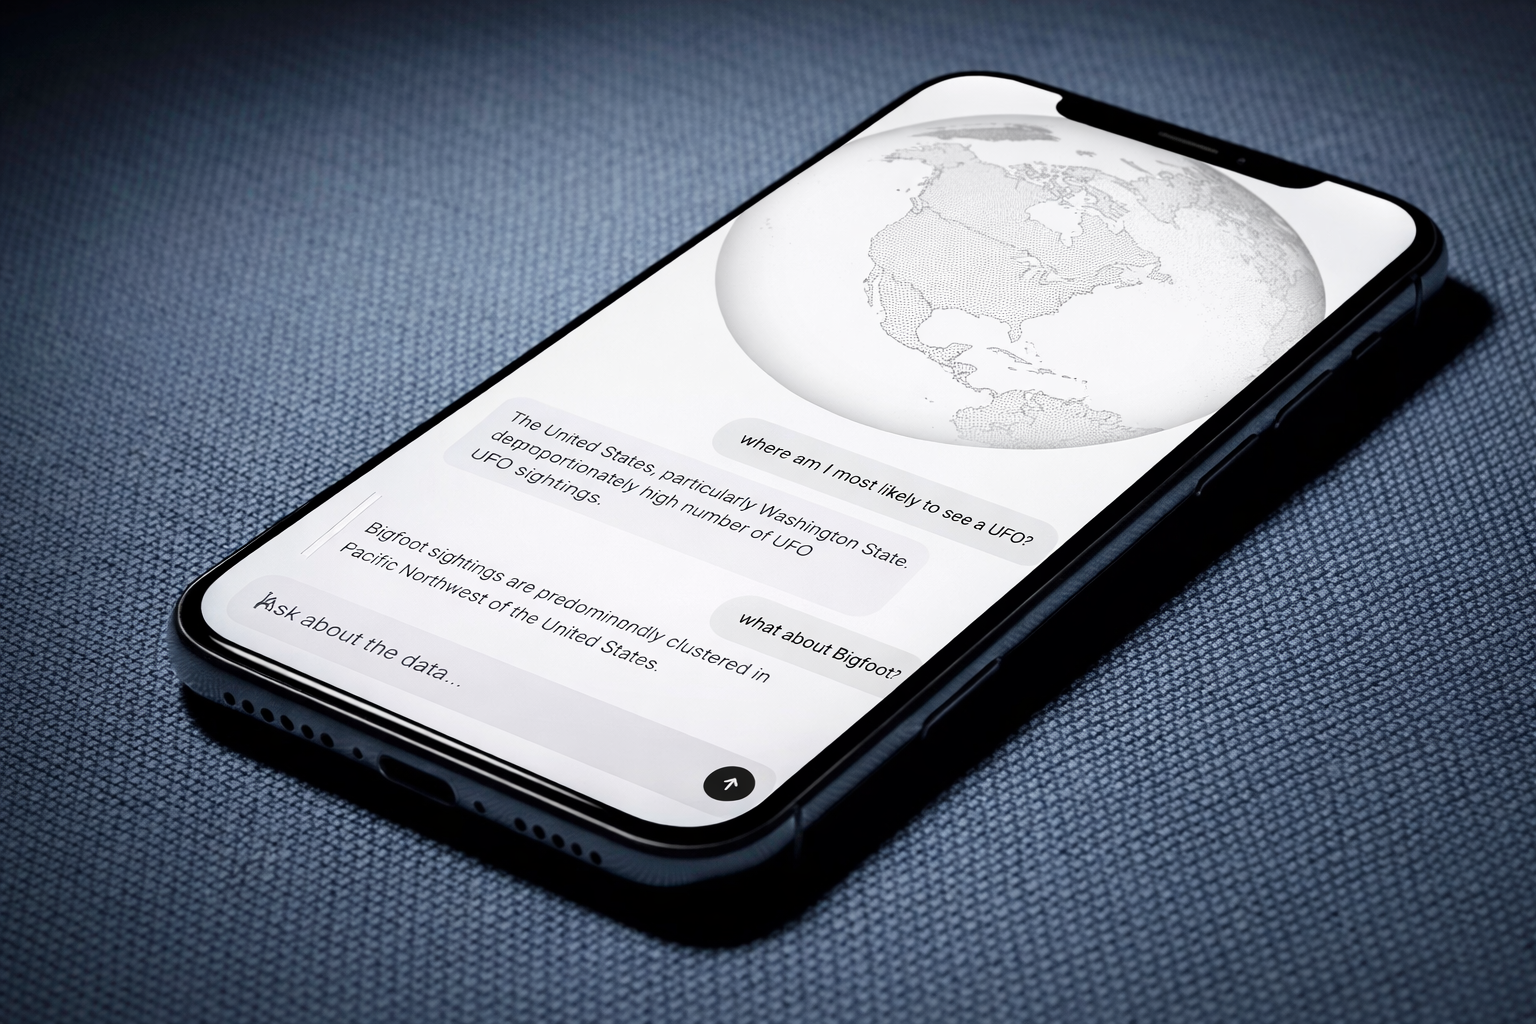
Strange Atlas started because I genuinely wanted to build it. I've always been drawn to the unexplained - UFO sightings, shipwrecks, haunted places - and I wanted to see all of it at once, on a globe I could spin and explore. Not pins on a flat map, but a living, glowing landscape you could get lost in. The goal was something closer to a National Geographic spread than a dashboard - editorial, visual, and fun to just sit with.
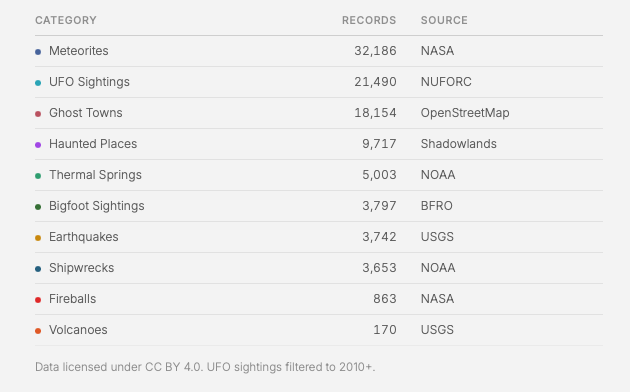
The project processes 354,770 records from the Strange Places v5.2 dataset (CC BY 4.0), filtering to ~99,000 high-quality geocoded points across 10 categories: UFO sightings, Bigfoot encounters, haunted places, volcanoes, shipwrecks, and more. Coordinates are validated, duplicates removed, and geographic overlaps resolved using Haversine distance calculations.
Built on Three.js r128 with a custom Fresnel-shaded globe, dot-matrix continents rendered from TopoJSON, and category-specific neon glow shaders. No framework, just vanilla JavaScript controlling a BufferGeometry of ~99K points. A Cloudflare Worker proxies "Ask Atlas" AI chat requests to Kimi 2.5, keeping API keys server-side.
The approach was "editorial, not analytic." Light backgrounds and generous negative space replace the typical dark-mode data dashboard aesthetic. A single typeface (Inter) maintains typographic discipline. Category toggles use neon glow effects as functional UI, not decoration. Every visual choice serves the narrative: these are real places where strange things were reported.
End-to-end product execution: data engineering, 3D graphics programming, shader authoring, API architecture, UX design, and AI integration, all coordinated through AI-assisted development with Claude. The project shows how a single builder can ship a polished, data-rich interactive experience by combining domain judgment with modern AI tooling.